 01
Map unequal exposure
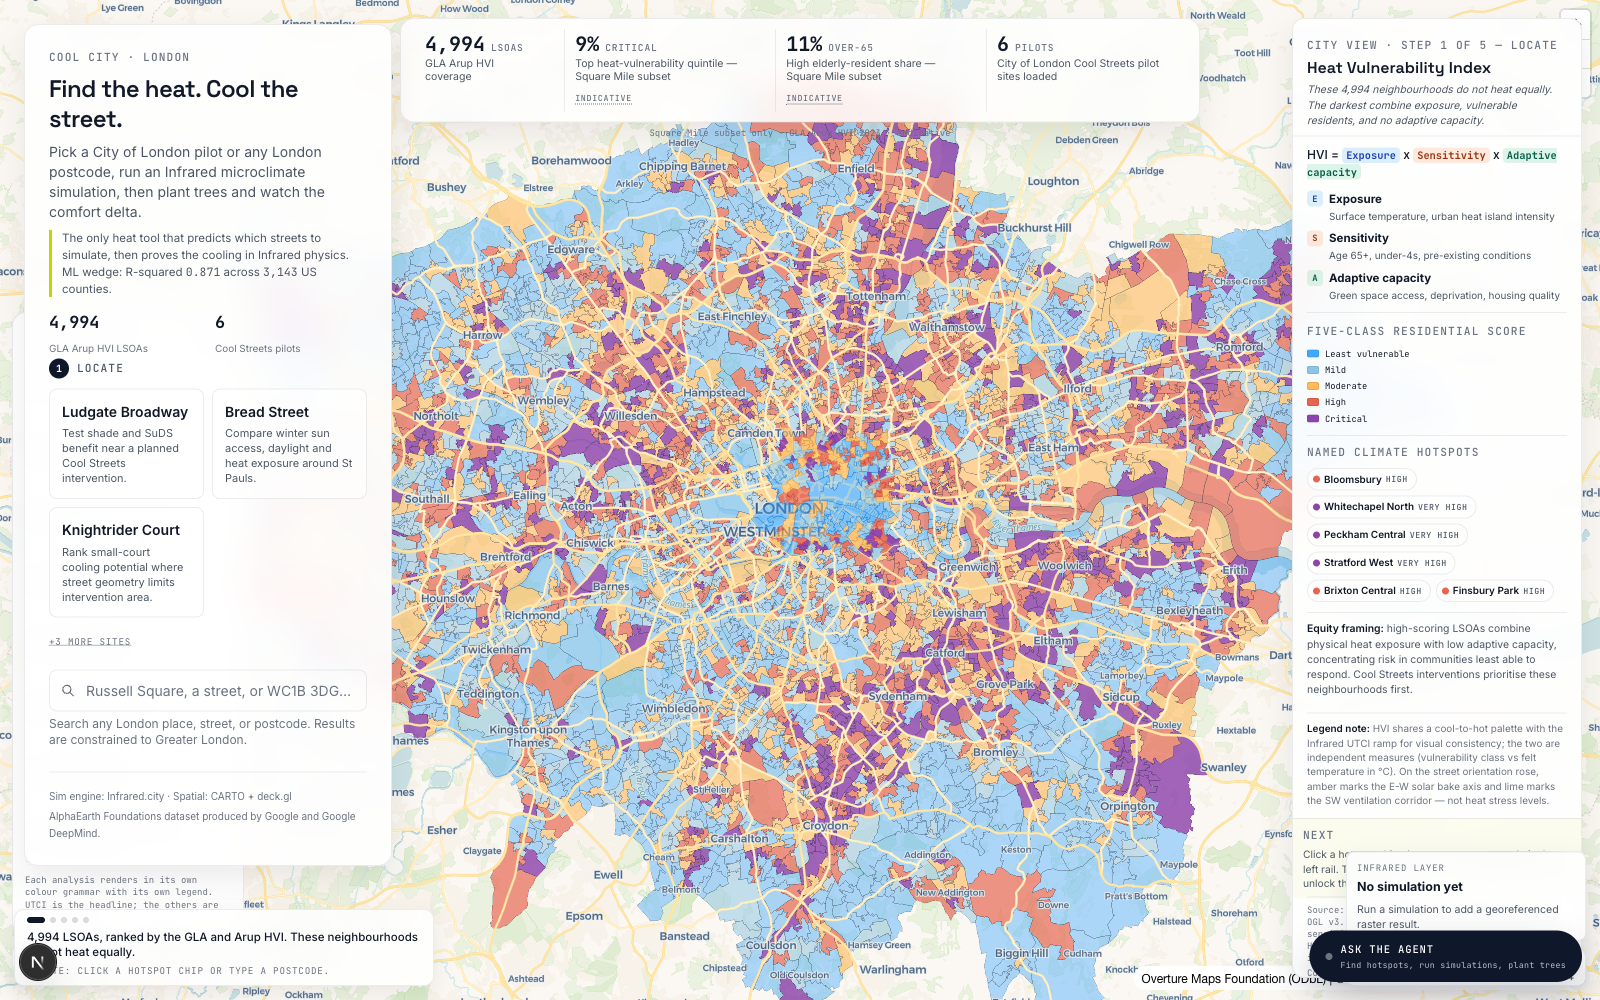
Start with the GLA and Arup Heat Vulnerability Index, then reveal where high exposure, sensitivity and lower adaptive capacity meet.
Heat-risk civic intelligence
A public map that turns London heat vulnerability, 15-minute access and Infrared UTCI simulations into a story people can inspect, share and act on.
Kew Gardens, 26 May 2026
London LSOAs in the HVI layer
Heat-adjusted access lens
City of London pilot sites
The product story
01Start with the GLA and Arup Heat Vulnerability Index, then reveal where high exposure, sensitivity and lower adaptive capacity meet.
 02
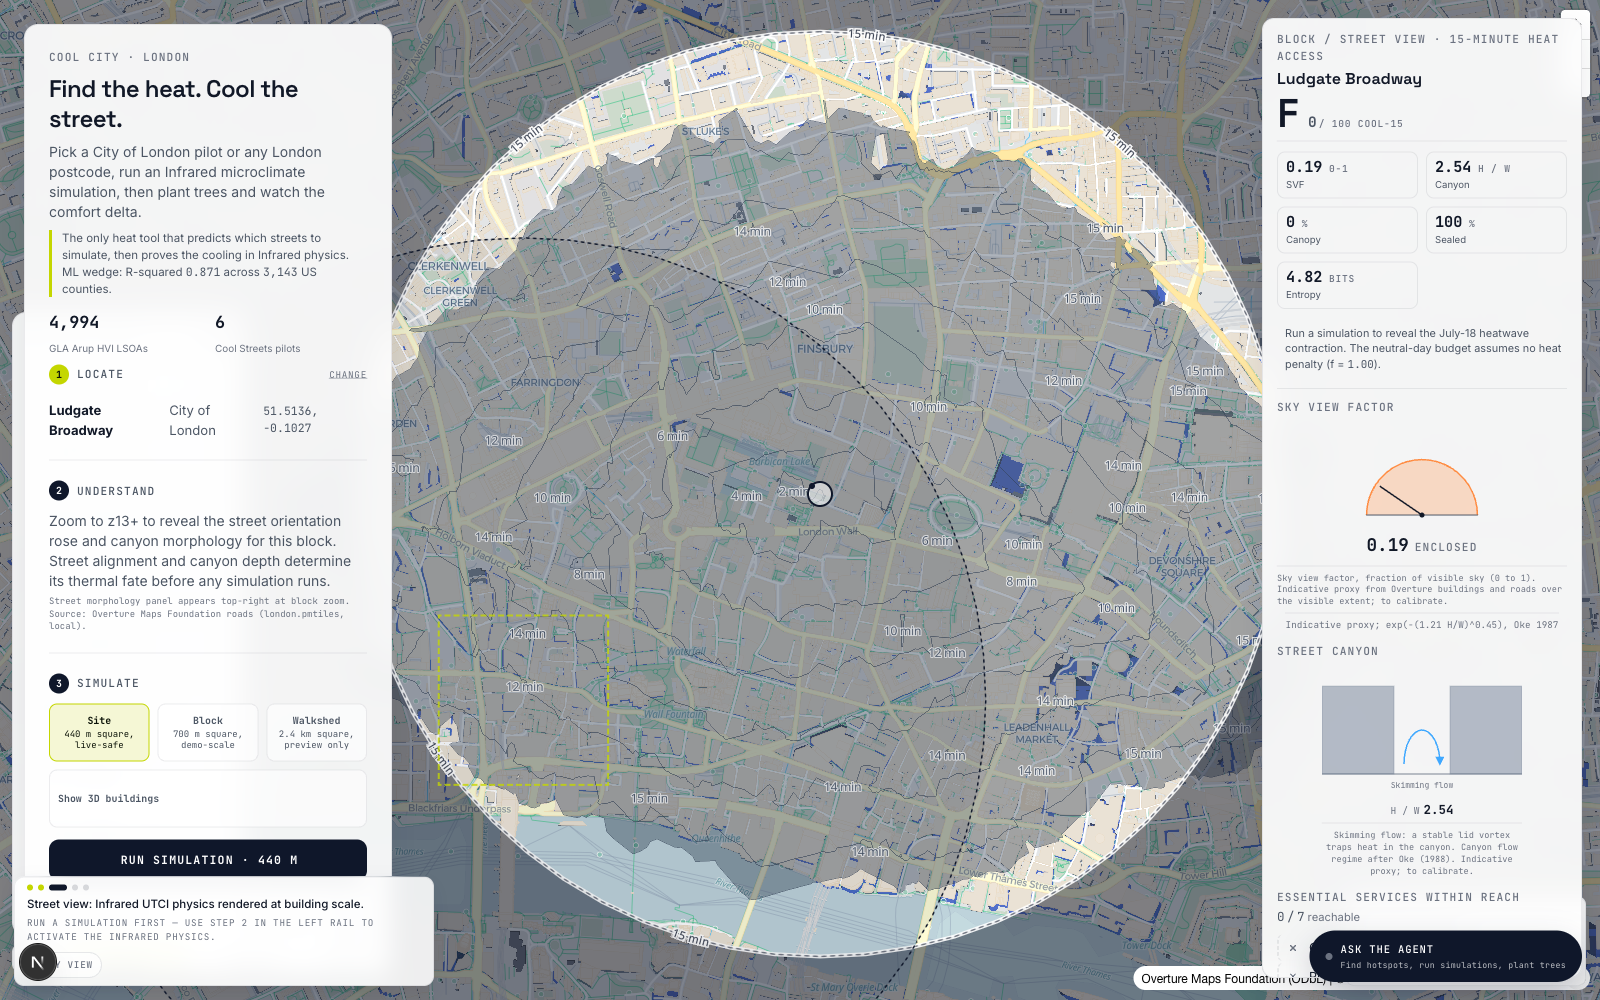
Move the pedshed and watch the area of concern change in minutes, not abstract buffers, so the map reads like a lived journey.
 03
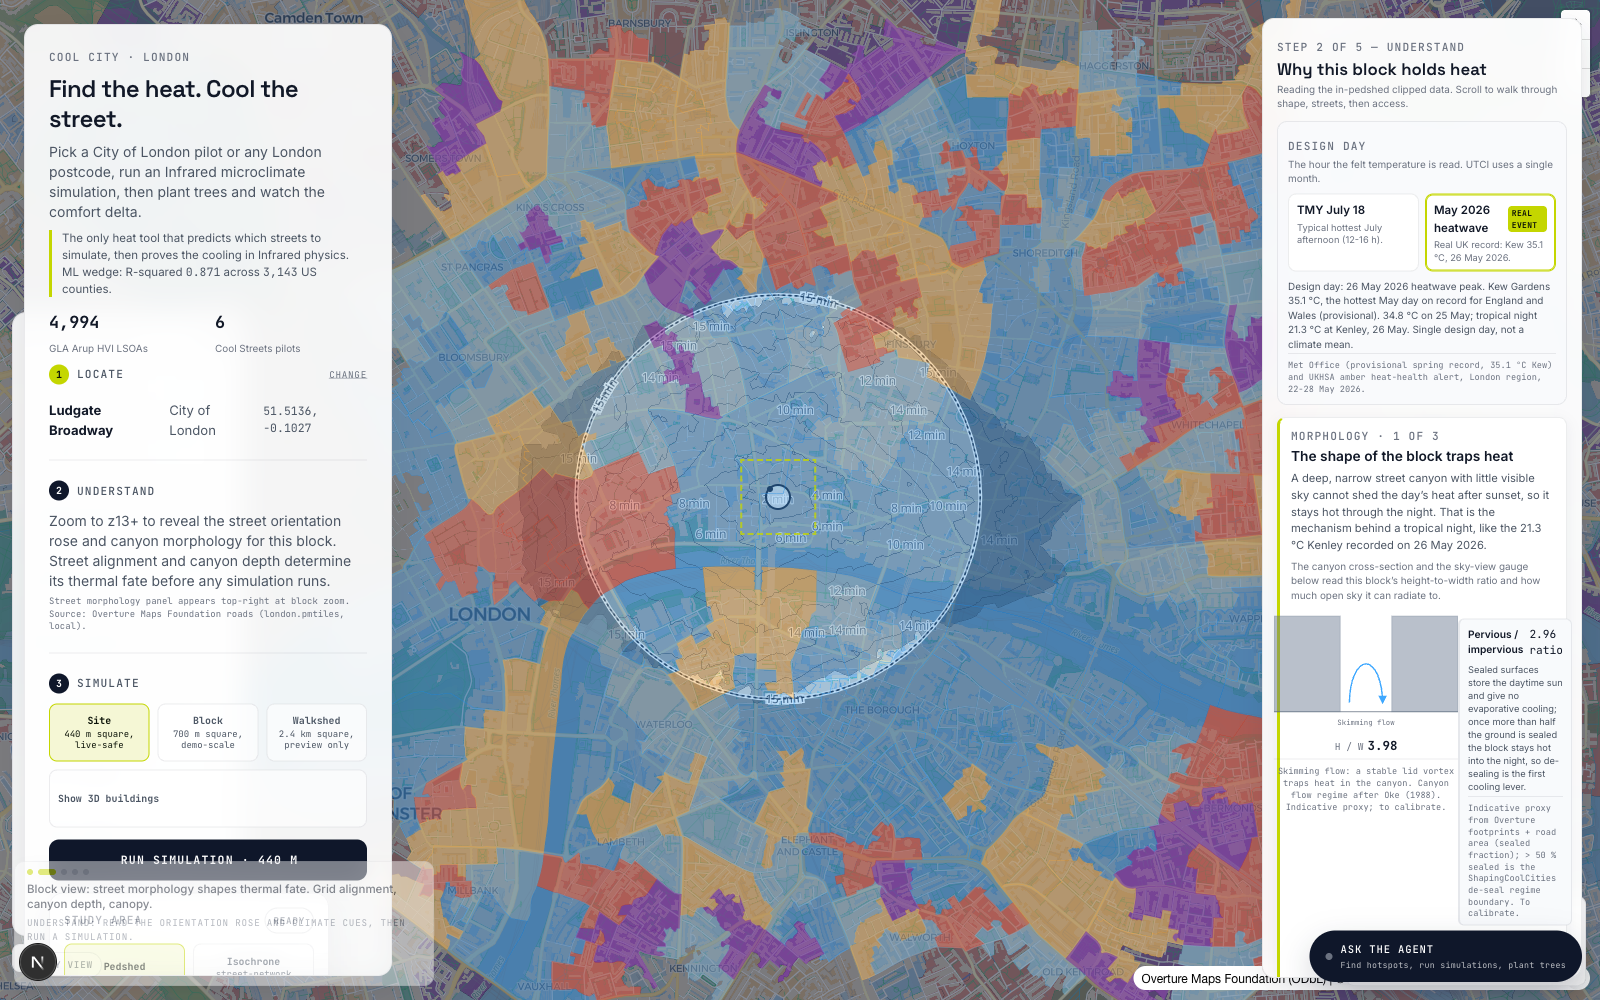
The real May 2026 event becomes a design day for comparing how access, morphology and vulnerability respond under stress.
 04
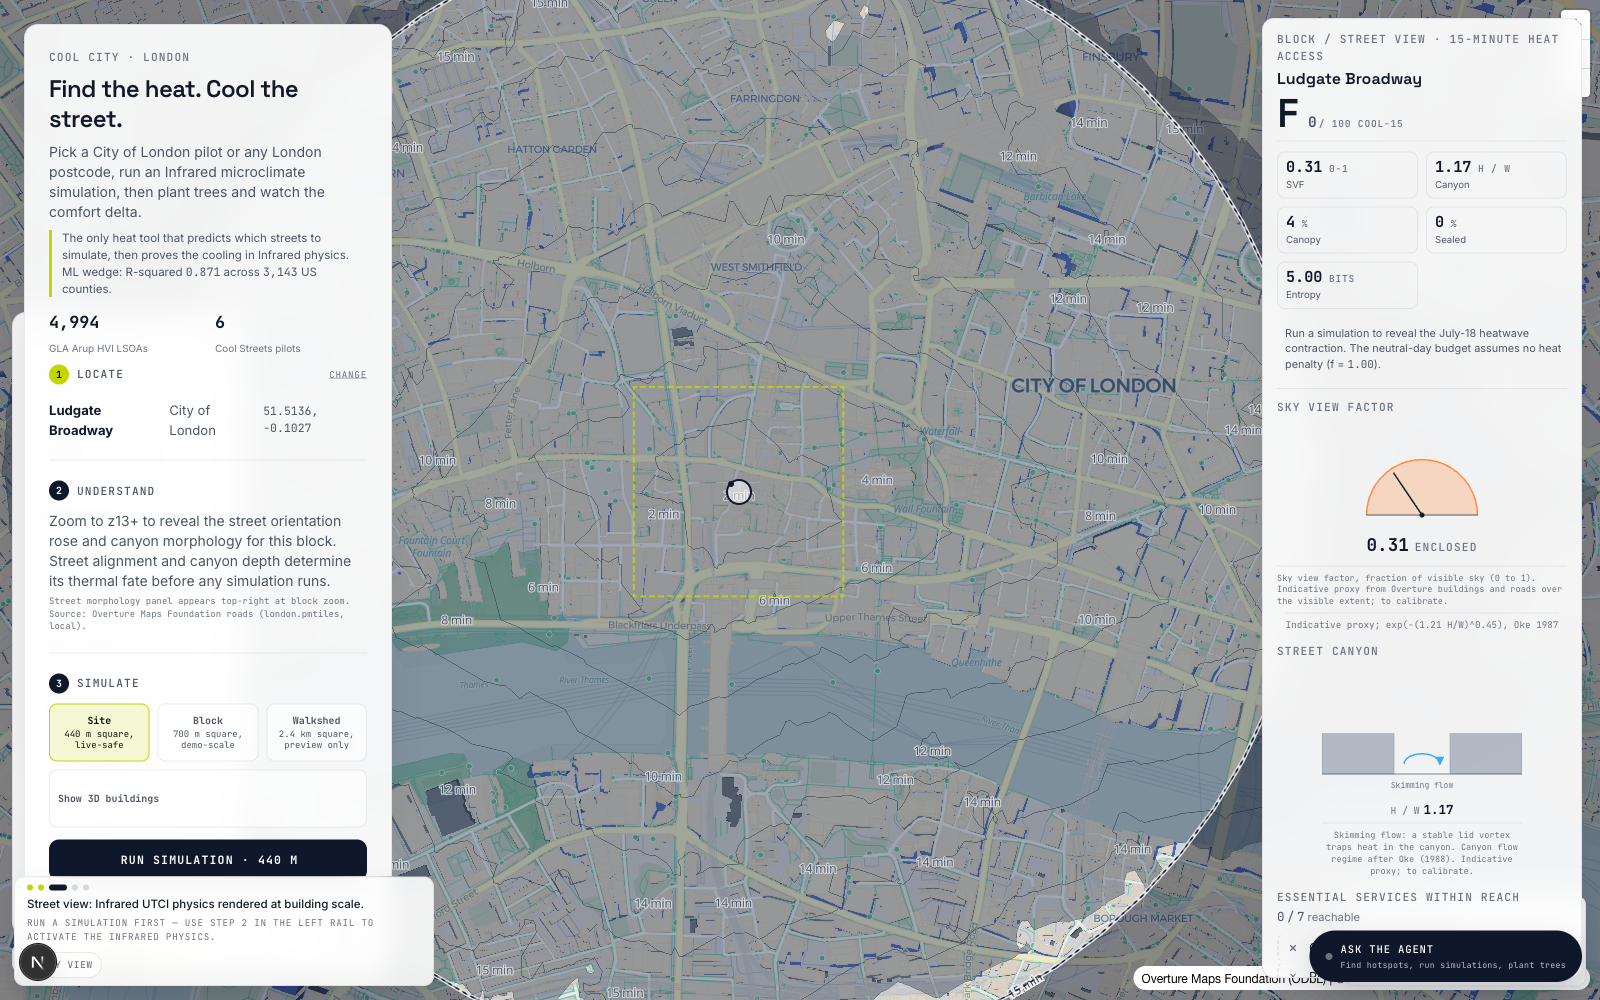
Run Infrared UTCI physics, compare design options and explain the block in plain English for planning, design and public review.
Share asset